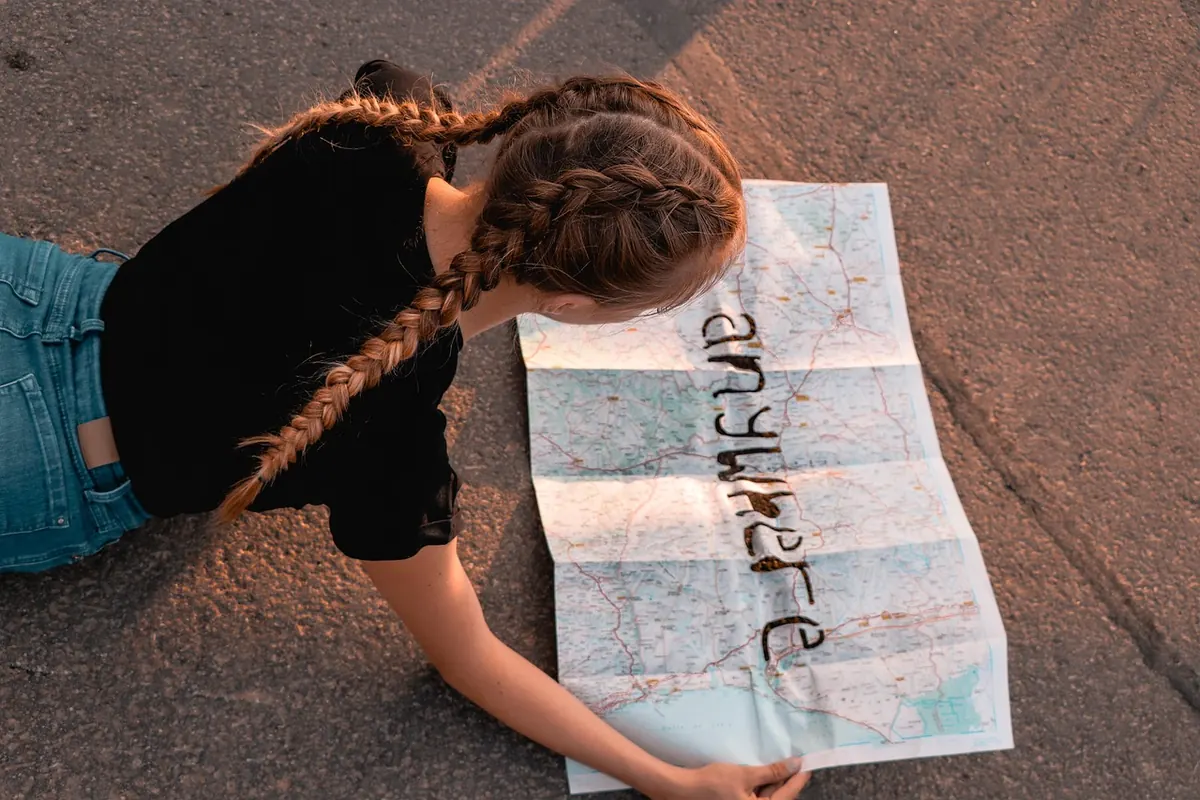
Open a hill map and the brown lines are usually the first thing you notice: hundreds of them, squirming across the paper like something spilled. They are also the most useful thing on the sheet. Get comfortable with them and you can tell from your kitchen table whether that path up the far side of the valley is a gentle amble or a hands-on-knees grind. Ignore them and you will find out the hard way, usually about ten minutes after the tea shop shuts.
A contour line joins up points that sit at the same height above sea level. Imagine slicing a hill horizontally, like a loaf of bread, and drawing round the edge of each slice. Stack the outlines on a flat sheet and you have a contour map. The hill is still three-dimensional; you are just reading it in slices.
Three rules cover most of it. The vertical gap between one line and the next is always the same, so the only thing that changes across the map is how far apart the lines sit. Lines that sit close together mean the ground rises quickly. Lines that sprawl apart mean it rises slowly. And the shape of the lines — not just their spacing — tells you whether you are looking at a ridge, a valley, a shoulder or a cliff.
Before you read anything else, find the contour interval in the map legend. Ordnance Survey Landranger maps use 10-metre contours; Explorer maps often use 5 metres in upland areas. The interval is printed on the sheet, so check rather than assume — guessing wrong throws out every gradient you work out afterwards.
Then look for the index contours. Every fifth line is drawn bolder and labelled with its height, which gives you a ladder to climb. In a 10-metre interval, the bold lines sit 50 metres apart. Count the thin lines between two of them and you can put a height on any point on the hillside without a single grid reference. Spot heights — small black dots with a number beside them — fill in the gaps at summits, cols and road junctions.
Spacing is your gradient meter. Once you have the interval and the map scale, the gap between lines becomes arithmetic rather than guesswork. On a 1:25,000 map, one centimetre on paper is 250 metres on the ground, so four millimetres is 100 metres of walking.
Rise ÷ run × 100 gives the gradient as a percentage. Ten metres of climb over 100 metres of ground is 10 per cent — roughly 1 in 10.
Read the spacing along the route you plan to walk, and you will spot the character of the climb before your boots are on:
Height numbers are not always to hand, especially in mist. Shape alone will keep you right, because water runs downhill and contours have to bend around the ground it runs through.
Where a contour crosses a stream, it makes a V pointing uphill, upstream. The sharper the V, the steeper the valley head. A spur or ridge does the opposite: the lines form a V or U pointing downhill, away from the high ground, like a finger poking out from the hillside. Two sets of these pointing at each other, with ground falling away on both sides, mark a col or saddle — the easiest crossing point between two tops.
Summits appear as closed rings, with the smallest ring on the inside. And everywhere else, downhill lies at right angles to the lines. If you know which way the ground drains, you know which way to walk, even with the cloud down and the compass out.
Two routes to the same summit, same height gain, very different days out. A path up a spur gives you firmer, drier ground and a view opening with every step. A path up a re-entrant — the V-shaped fold where two sides of a valley meet — is often wet, loose and steeper than the contours suggest, because the lines crowd together at the head of it. Add a stream to the picture and the choice usually makes itself.
Contours turn a vague hope into a plan. Work through it in this order.
For the descent, the same lines read in reverse. Tight contours below a summit mean a knee-jarring drop; a spur gives you a natural staircase with better footing than the valley floor, which collects water and mud. If the lines on either side of a proposed descent are packed together, look again.
Contours describe steepness and shape, nothing more. They will not warn you about bogs, deep heather, bracken in late summer, broken walls, loose scree or a path that has quietly disappeared. They also tell you nothing about the weather or how your legs will feel at four o'clock. Treat the brown lines as the skeleton of the day and let the map's other symbols, a recent guidebook and your own eyes fill in the rest.
Do this in the car park and the day runs smoother. Find the interval. Trace the index contours with a finger so the heights settle in your head. Count the lines on your climb and note the steepest stretch so you know where to expect a breather. Check which way the ground drains at every junction you plan to meet. Then pick your escape route — the easiest contour-following line off the hill if the weather turns.
That is the whole skill. A few minutes with your thumb on the paper, a rough sense of what 1 in 5 feels like underfoot, and the hillside stops being a surprise. Take a paper map, keep it in a case, and keep looking at it as you walk — the lines start to match the ground under your boots faster than you would think.
Photo: 11417994 / Pixabay
How to walk through British villages and farmland without causing offence: gates, livestock, driveways, rights of...
A first-timer's guide to the South West Coast Path: reading tides, staying safe near cliff edges, judging distances...

A practical guide to minimising your impact on the British countryside, covering path use, waste, wildlife...

Exploring paths, places, and stories of rural Britain..
